12 minutes
Dynamic Binary Instrumentation and Pin
Dynamic Binary Instrumentation is the process of monitoring or measuring a binary’s execution and its behavior, such as resource usage, during runtime. It allows us to focus on specific parts of a binary for various purposes such as vulnerability analysis, dynamic tainting and state analysis.
We will skip over Source Instrumentation since it requires source code of the application, which is pretty rare in real world scenarios.
Instrumentation Code
The technique requires injecting Instrumentation Code into a running binary. DBI Frameworks introduce a layer between the OS and the application, making this injected code completely transparent to the application we inject it in. We simply add hooks to parts of interest. These hooks intercept the instruction execution and transfers control to the instrumentation code, thus we can observe and modify the instructions of the program being instrumented, as it executes.
Code Coverage
High code coverage will most definitely require running the binary a lot of times. Since different types of input will trigger different paths of the binary, this section could particularly benefit from the help of fuzzers.
Granularity
There are different levels at which we can apply instrumentation.
BBL: Basic Block
Sequence of instructions that is always entered at the top and exited at the bottom by a fall through and/or taken branch. If Pin detects a jump to an instruction in the middle of a bbl, it will create a new bbl beginning at the target.
TRACE: Trace
Sequence of instructions that is always entered at the top and may have multiple exits. If Pin detects a jump to an instruction in the middle of a trace, it will create a new trace beginning at the target.
IMG: Image of the Binary
Image instrumentation lets the Pintool inspect and instrument an entire image, IMG, when it is first loaded. A Pintool can walk the sections(SEC) of the image, the routines(RTN) of a section, and the instructions(INS) of a routine.
Performance
The impact/overhead on performance/runtime of the binary is dependent on many factors, but it will most definitely depend on the granularity of instrumentation, as well as the tasks performed by the instrumentation code. The execution will be delayed between each hook, for as long as the instrumentation code does its job.
Use cases
- Profiling for compiler optimization/performance profiling.
- Instruction profiling
- Basic block count
- Value profile
- Bug detection/Vulnerability identification/Exploit generation.
- Find references to uninitialized and unallocated addresses
- Inspect arguments at a particular function call
- Inspect function pointers and return addresses
- Record & replay
- Architectural research.
- Processor and cache simulation
- Trace collection
Pin
Pin is an instrumentation engine created by Intel. It comes packed with a JIT for x86 and x86_64.
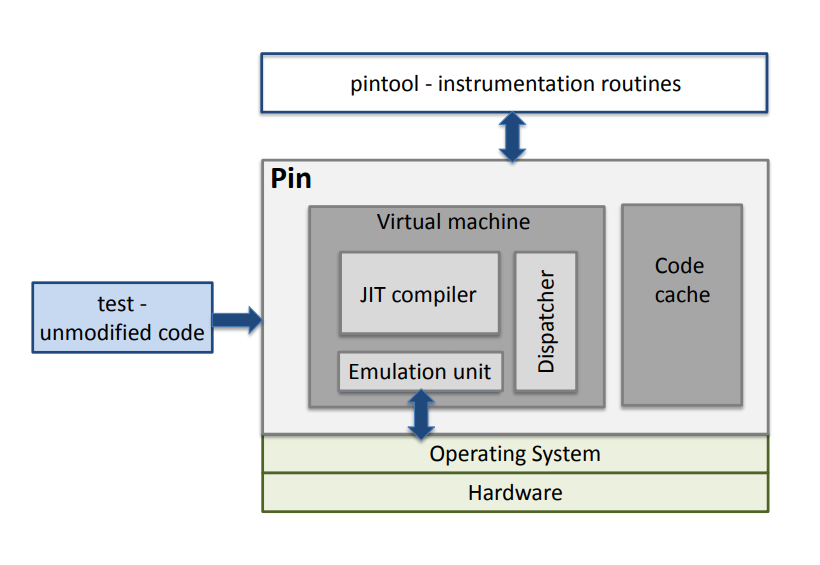 Architecture overview.
Visit https://software.intel.com/sites/landingpage/pintool/docs/81205/Pin/html/index.html for the documentation.
It allows us to build instrumentation programs, or analysis tools, known as Pintools, that register hooks on events in the program.
- Instrumentation Routines are called only on the first time when something happens.
- Analysis Routines are called every time this object is reached.
- Callbacks are called whenever a certain event happens.
Pin has two modes:
JIT Mode
- Pin creates a modified copy of the application on-the-fly.
- Original code never executes. The only code ever executed is the generated code.
- The original code is only used for reference.
- When generating code, Pin gives the user an opportunity to inject their own code (instrumentation).
Probe Mode
- A method of using Pin to wrap or replace application functions with functions in the tool.
- A jump instruction (probe), which redirects the flow of control to the replacement function is placed at the start of the specified function.
- The bytes being overwritten are relocated, so that Pin can provide the replacement function with the address of the first relocated byte. This enables the replacement function to call the replaced (original) function.
- Probes can only be placed on RTN boundaries.
Injection Process
 Injection process.
Pin’s injection procedure.
Firstly, a 32 bit script (not shown in the figure) is executed with the necessary parameters (pin -t Pintool – program), which determines the correct version of Pin (pinbin) for the current platform and prepares the system for its execution (e. g. sets the necessary environment variables). The spawned pinbin process can be seen in (a) on the left. The injection process involves a fork of pinbin to a new process (1), followed by a fork of the same process (2). The second process then exits (3) and leaves the original pinbin executable with its grandchild process, effectively a daemon, to continue running. Next as seen in (b), the newly created daemon process, called injector, utilises the Unix ptrace API (4) to obtain control of its parent’s execution, pinbin (injectee) which awaits that by issuing a PTRACE_TRACEME request. The injectee then calls execve(program, argv, envp) (5) which preserves the original Process Identifier (PID) but the text, data, BSS, and stack of the calling process are overwritten by that of the program loaded. After that, the injector pauses the execution of the injectee and loads the essential Pin components (pinbin, libraries, Pintool) into the address space of the newly started program which will be instrumented (6), illustrated in (c). Before detaching and exiting (8), the injector passes the control of the instrumented program to the new copy of Pin, residing in injectee’s memory (d). After the Pintool is initialised, Pin creates the initial context and starts jitting the application at its entry point (7). By default, the parent process and its grandchild are respectively injectee and injector, however, these roles can be switched by setting the -injection child option when starting Pin.
Setup
- Visit https://software.intel.com/content/www/us/en/develop/articles/pin-a-binary-instrumentation-tool-downloads.html and download the package that suits your OS and CPU architecture.
- I’m on a linux machine running x86-64.
- The command I used:
wget https://software.intel.com/sites/landingpage/pintool/downloads/pin-3.13-98189-g60a6ef199-gcc-linux.tar.gz -P /tmp/ - Using Pin 3.13(Kit 98189) in June 2020.
- Untar the gzip into a folder named
pin-dir.- Command Format:
mkdir pin-dir && tar -zxvf PIN_GZIP -C pin-dir --strip-components=1, where PIN_GZIP is the name of the downloaded gzip. - The command I used:
mkdir pin-dir && tar -zxvf pin-3.13-98189-g60a6ef199-gcc-linux.tar.gz -C pin-dir --strip-components=1
- Command Format:
- Move the tool folder to
/opt.- Command:
sudo mv /tmp/pin-dir /opt/
- Command:
- Navigate inside the folder and compile all source files.
- Find your CPU architecture by running
lscpu.- if it is 64-bit, command:
cd /opt/pin-dir/source/tools && make all - If it is 32-bit, command:
cd /opt/pin-dir/source/tools && make all TARGET=ia32
- if it is 64-bit, command:
- Find your CPU architecture by running
- Setup complete.
Compiled script can be downloaded from here.
Execution
Format: ./pin -t [full path to tool] -- [full path to app]
The tools are made into shared libraries so that they can be loaded anywhere in the memory space of the Pined process at runtime, since dynamic binary instrumentation requires instrumentation code to be injected into the process at runtime.
NOTE for Windows:
- .so is the extension for shared objects in Linux, so if you’re working on windows, swap it with .dll wherever you encounter it in the guide.
- /opt/pin-dir would be replaced with whatever directory the Pin zipfile from Intel’s site is extracted in.
- Visit https://rayanfam.com/topics/build-a-simple-pin-tool/ for a more comprehensive guide.
To execute a pre-made pintool (modify folder and path suffixes based on CPU architecture),
- Command:
./pin -t /opt/pin-dir/source/tools/ManualExamples/obj-intel64/PIN_TOOL.so – BINARY_PATH, where PIN_TOOL is the tool to be used and BINARY_PATH is the path to the bianry to be isntrumented. - Output can be found in the default file:
/opt/pin-dir/PIN_TOOL.out, where PIN_TOOL is the name of the pintool executed.
For example, if I want to run the inscount0 pintool on a binary named calc located in my home folder, I would execute the command ./pin -t /opt/pin-dir/source/tools/ManualExamples/obj-intel64/inscount0.so – ~/calc, and read the output by executing cat /opt/pin-dir/inscount0.out.
To make your own pintool, let’s setup a working directory first.
-
Make an empty directory inside the tools folder.
- Command:
/opt/pin-dir/source/tools/CUSTOM_DIR, where CUSTOM_DIR is the name of the custom working directory. - Copy
makefile, command:cp /opt/pin-dir/source/tool/ManualExamples/makefile /opt/pin-dir/source/tool/CUSTOM_DIR/. - Copy
makefile.rules, command:cp /opt/pin-dir/source/tool/ManualExamples/makefile.rules /opt/pin-dir/source/tool/CUSTOM_DIR/. - Edit
makefile.rules.- There’s a line beginning with the words
TEST_TOOL_ROOTS :=, clear out all the names in front of the:=. Put the name of your tool in front of it later on to build it. - Comment the last two lines. They are:
- There’s a line beginning with the words
$(OBJDIR)divide_by_zero$(EXE_SUFFIX): divide_by_zero_$(OS_TYPE).c# $(APP_CC) $(APP_CXXFLAGS_NOOPT) $(COMP_EXE) $(APP_LDFLAGS_NOOPT) $(APP_LIBS)
- Command:
Now we can build the tool.
- Write the tool’s source code inside
CUSTOM_DIR, say it’s name beCUSTOM_TOOL.CPP. - Add the name of the tool, namely
CUSTOM_TOOL, in themakefile.rulesas stipulated above. - Execute the command:
make obj-intel64/CUSTOM_TOOL.so - Now you can run this custom pintool just as a pre-made one, mind the change of directory.
- Command:
./pin -t /opt/pin-dir/source/tools/CUSTOM_DIR/obj-intel64/CUSTOM_TOOL.so -- BINARY_PATH
- Command:
Visit the documentation’s main page and see under the heading ”Pin’s makefile Infrastructure” for a more comprehensive guide.
Debugging
Pintools can be debugged using the -pause_tool switch, followed by the number of seconds to wait until the debugger is attached to its process.
Example
We’ll create a simple C++ program to instrument.
Since instruction counting is a cliché now, we’ll do something different. Let’s find loops and predict their number of iterations. It’s a rudimentary approach full of loop holes, but works for naïve programs.
// loop.cpp

#include <iostream>

using namespace std;

int looper0(int low, int high) {
    int i, sum = 0;
    for(i = low; i < high; i++)
        sum += i;
    return sum;
}

int looper1(int low, int high) {
    int i, sum = 0;
    for(i = low; i < high; i++)
        sum += i;
    return sum;
}

int main()
{
    int sum;

    sum = looper0(0, 250);
    sum += looper1(0, 250);
    sum += looper0(0, 250);

    std::cout<<sum<<endl;

    return 0;
}
Compile the file by executing g++ loop.cpp -o loop.
All the program does is call two functions with a loop each, at different types. So based on the source code, loop inside looper0 should run 500times while the one in looper1 should run 250 times.
Let’s write a pintool to predict the loops.
// loopcount.cpp

#include <iostream>
#include <fstream>
#include <unordered_map>
#include <iterator>
#include "pin.H"

using std::cerr;
using std::endl;
using std::ios;
using std::string;

// Map to track loops
std::unordered_map<ADDRINT, int> u;

// Main Binary Image
IMG MainBinary;

// Checks if the instruction comes from the binary being instrumented.
BOOL CheckBounds(ADDRINT addr) {
    if(addr < IMG_HighAddress(MainBinary) && addr > IMG_LowAddress(MainBinary)){
        return true;
    }
    return false;
}

VOID Analyse(ADDRINT addr, BOOL taken){

    if(CheckBounds(addr)) {

        // If the branch is not taken, then it follows the fall through, that is, reiteration.
        if(!taken) {
            if (u.find(addr) == u.end()){
                u.insert({addr, 1});
            }
            else{
                ++u[addr];
            }
        }
    }
}

VOID Instruction(INS ins, VOID* v)
{
    if(INS_IsBranch(ins) && INS_HasFallThrough(ins)){
        // std::cout << "[+] Condition Branch encountered: "<<INS_Disassemble(ins)<<endl;
        INS_InsertCall(ins, IPOINT_BEFORE, (AFUNPTR)Analyse, IARG_INST_PTR, IARG_BRANCH_TAKEN, IARG_END);
    }
}

VOID Image(IMG img, VOID* v)
{
    if(IMG_IsMainExecutable(img)){
        MainBinary = img;

        std::cout << "[*] Main Binary Image: " << IMG_Name(img) << std::endl;
        std::cout << "[+] Image limits 0x" << std::hex << IMG_LowAddress(img) << " - 0x" << IMG_HighAddress(img) << endl;
    }
    else {
        std::string name = IMG_Name(img);
        std::cout << "[*] Image: " << name << std::endl;
    }
}

// This function is called when the application exits
VOID Fini(INT32 code, VOID *v)
{

    // Iterate and print keys and values of unordered_map
    for( const auto& n : u ) {
        if(n.second > 1) {
            printf("Loop condition encountered at: 0x%lX\n", n.first);
            printf("Iterations: %d\n", n.second);
        }
    }

    std::cout << "[+] End of analysis." << std::endl;
}

int main(int argc, char* argv[])
{
    std::cout << "[+] Initialising PIN..." << std::endl;
    PIN_InitSymbols();
    PIN_Init(argc, argv);

    IMG_AddInstrumentFunction(Image, NULL);
    INS_AddInstrumentFunction(Instruction, NULL);

    PIN_AddFiniFunction(Fini, NULL);

    std::cout << "[+] Starting Instrumentation..." << std::endl << std::endl;
    PIN_StartProgram();

    return 0;
}
A bunch of methods and API calls need to be taken a look at.
The main function, main, is responsible to get Pin ready and started.
PIN_InitSymbols:- Initializes the symbol table code. Pin does not read symbols unless this method is called.
PIN_Init:- Initializes the PIN instrumentation engine. Takes the command line argument specifiers
argcandargvas taken bymainitself.
- Initializes the PIN instrumentation engine. Takes the command line argument specifiers
IMG_AddInstrumentFunction:- Registers a callback to be made to the function passed in the parameter whenever a new image(library or a binary) is loaded.
INS_AddInstrumentFunction:- Adds a function to instrument at instruction level granularity.
PIN_AddFiniFunction:- Calls the specified function right before the application exits.
- Not an instrumentation routine.
- More than one can be present.
PIN_StartProgram:- Starts executing the application, when Pin is in JIT mode(default setting).
The image instrumentation function, Image, prints all information about the images that get loaded during the course of execution.
IMG_IsMainExecutable:- Checks if the image is the binary being instrumented.
IMG_LowAddress:- Fetches the lowest address of any code or data loaded by the image.
IMG_HighAddress:- Fetches the highest address of any code or data loaded by the image.
- Address of the last byte loaded by the image.
IMG_Name:- Fetches the name of the image.
The instrumentation function, Instruction, cycles through all instructions and registers a callback if the instruction is a branching one and has a fall through. This is a defining characteristic of a loop.
INS_IsBranch:- Checks if the instruction is a branch instruction.
INS_HasFallThrough:- Checks if there is an instruction following the current one to follow a natural flow of execution if the branch is not taken.
INS_InsertCall:- Inserts a call to the specified function.
- First argument is the instruction to be instrumented.
- Second argument is the position where the call is to be made, that is, before the instruction, after it or after branching.
- IPOINT_BEFORE is always valid for all instructions.
- IPOINT_AFTER: is valid only when a fall-through exists (i.e. Calls and unconditional branches will fail).
- IPOINT_TAKEN_BRANCH: is invalid for non-branches.
- Third argument contains the instrumentation code.
- The following arguments are the arguments needed by the instrumentation function.
- Last argument is always IARG_END.
The analysis function, Analyse, creates a map of all functions that we can suspect of being a loop.
The bound checking function, CheckBounds, checks if the instruction address is between the bounds of the lowest and highest address of the main binary in memory, that is, makes sure the instruction being instrumented comes from the binary itself and not from any of the other images loaded.
The finalizing function, Fini, is called right before the binary exits. It iterates through the map and prints all the instructions’ address along with the number of times they were parsed, if they were parsed more than once. These could be loop conditionals.
// Result of the instrumentation

$ pin -t obj-intel64/loopcount.so -- ~/loop
[+] Initialising PIN...
[+] Starting Instrumentation...

[*] Main Binary Image: /home/hexterisk/Work/pin/calc
[+] Image limits 0x562fad148000 - 0x562fad14a1bf
[*] Image: /lib64/ld-linux-x86-64.so.2
[*] Image: [vdso]
[*] Image: /usr/lib/libstdc++.so.6
[*] Image: /usr/lib/libm.so.6
[*] Image: /usr/lib/libgcc_s.so.1
[*] Image: /usr/lib/libc.so.6
93375
Loop condition encountered at: 0x562FAD149186
Iterations: 500
Loop condition encountered at: 0x562FAD1491B6
Iterations: 250
[+] End of analysis.
Since ASLR is on, the base address would be different. So we verify the offsets by looking at the disassembly.
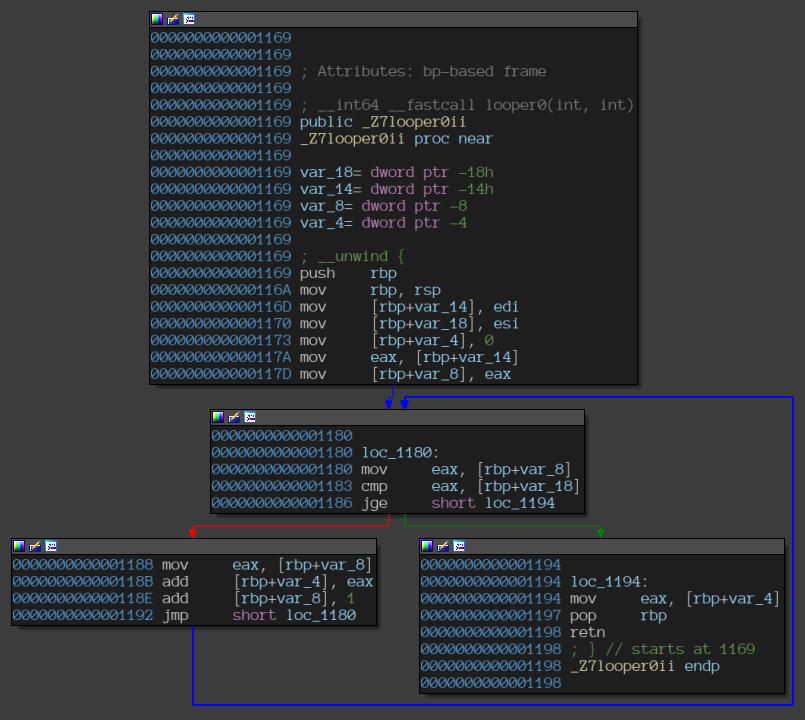 “looper0” function.
Notice the jge instrunction at the offset 0x1186.
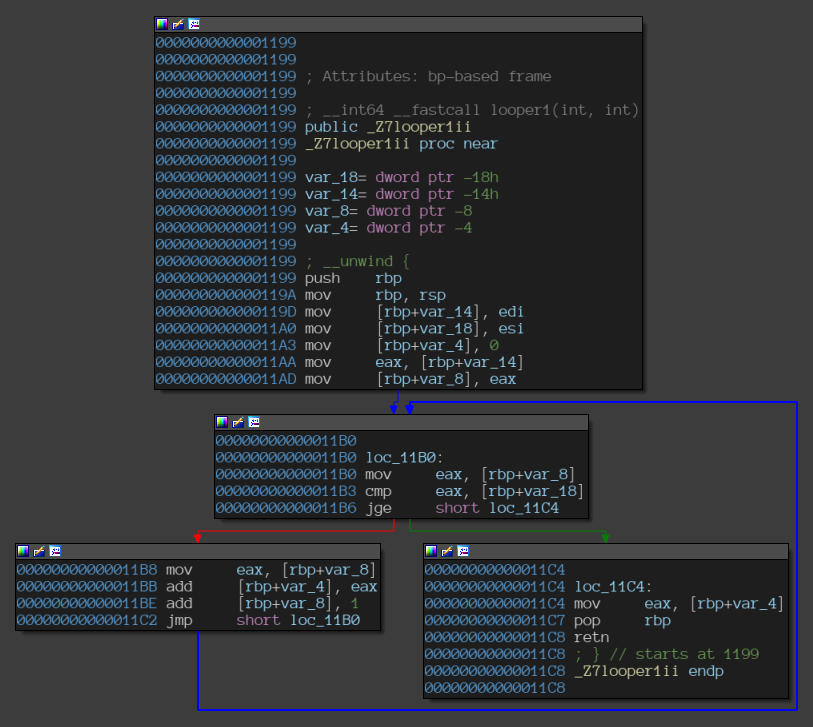 “looper1” function.
Notice the jge instruction at the offset 0x11B6.
The offsets are in line with the output we got on the console via our pintool.
Thus, the pintool was able to correctly classify the two loops with the correct number of iterations.
All the above API methods have been introduced in order to give the reader an idea of how the Pin engine works and how it’s working structure is. Browse the documentation, and you’ll most probably find the method that best suits your need. If not, you could definitely come up with a hacky approach using combinations of available methods that